What we can learn from patents data.
Part 1. The Big Picture.
The map below illustrates the locations of everyone whom was listed as an inventor in a patent whose application was filed in 2013. It does not come as much of a surprise that inventors are spread out quite unevenly around the world, with a noteworthy sparsity in developing regions like Latin America, Africa, the Middle East, and Central Asia, but also quite a few high-density centers. Among the latter are the usual suspects: in the United-States, Southern California and the North-East Coast have among the highest concentration of inventors in the world. In Europe, Germany seems to be leading the pack while in Asia, that role is taken on by Japan.
If you zoom in the map on North America, you'll notice that while on the US West Coast, inventors are packed very densily around a few cities - namely, Seattle and San José-San Francisco - it's a completely different story across the Atlantic : high numbers of inventors seem to be spread somewhat evenly across all of Germany, Switzerland, the Netherlands, Belgium, The United Kingdom, and across many other European cities. In Asia, the contrast is even more stark between Japan, South Korea, and Taiwan on one hand, and China, where only Shanghai and Hong Kong have any significant concentration of inventors, on the other.
A Historical Perspective : 1990-2016
While these disparities may seem massive, looking at historical data, from 1990 until 2016, offers a different perspective. This next map pictures the same frame as above, but illustrates the evolution of the density of inventors on this timeline as a timelapse. It should be noted that the chronology illustrated in this following graphs, as well as in all the other graphs in this article, is based on the dates at which the patent applications were filed, instead of the dates at which the patents were granted. The reasoning behind this choice is that at the time of the patent application, the innovation supporting it already exists, and what we want to paint here is a picture of innovation. This does however have as a consequence that after 2013, we obverse a rapidly diminishing number of patents and inventors. This is due to the long delays that can exist between the moment of filing a patent application and obtaining it, a delay of often a few years, and the fact that the PatentsView database only incorporates patents once they have been formally accepted.
What is perharps not so obvious when looking at the timelapse on this scale is the particular dynamics of the evolution of the distribution of inventors in different regions of the world. To better discern what is going on in Asia, Europe, and North America during this timeframe, we take a look at the maps which follow.
Most notably in South Korea and in Taiwan, at the turn of the new millenium, the number of innovators grows from a moderate size up to the same scale as Tokyo, Japan. This coincides perfectly with the democratization occuring in South Korea at that time.
What is most striking about Europe is that the region does not exhibit any significant change during the period in question. Some places - namely Paris and Munich - do seem to grow faster than other European countries but in general inventors remain mostly spread out accross the continent. One interesting fact to note is that the reunification of Germany does seem to lead to a steady growth in the number of inventors in the East after 1990.

As for the US, while at the start of the 1990's, the distribution of innovators closely resembles that of Europe - with the notable exception of the Mountain States - from 2000 onwards the density of inventors in a number of cities grows remarkably : New York, Boston, Austin, Houston, Seattle, Portland, San Francisco, Los Angeles, to name a few.
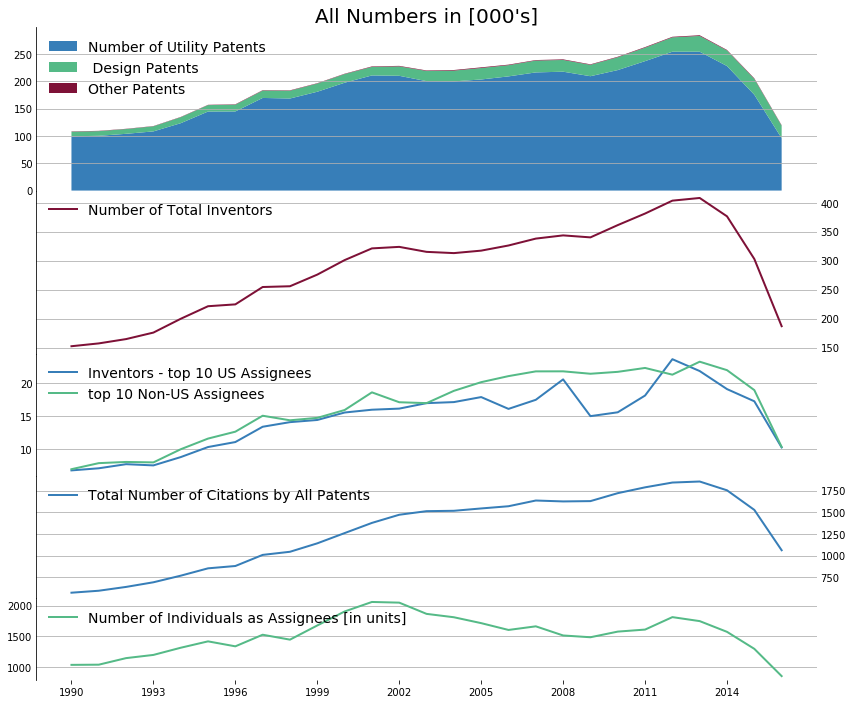
While the growth in the number of patents is staggering, from the second graph shown below we learn that the increase in the number of inventors listed in patent applications has grown even more: from 1990 to 2013, a more than 160% increase. So while almost all research fields today require always more specialization, an ever growing number of innovators are required in practice to actually innovate. Contrast this conclusion with the information seen on the bottom-most graph, which illustrates the number of individuals listed as assignees in patent applications during each year under consideration. While the number grows until the start of the 2000's, it actually starts shrinking after this point.
The initial growth in individuals as inventors, we suspect, can be attributed to the Dot-com bubble. in the late 1990's to early 2000's, a lot of capital was flowing to people whom inventors perceived as being technological visionaries. After these flows started to dry up, the number of individuals as assignees also started coming back down. While there are still around 1500 patent applications every year filed by individuals, this completely pales in comparison to the number of innovations made by people that are part of teams. In fact, in the third graph from the top, we see that the number of innovators that are part of the top 10 US-based and Non-US-based companies or organizations (ranked by number of patent applications in each year) represent at any given time around 20 times the number of solo innovators.
Finally, when we look at the total number of patents which are cited in patent applications each year, we can definitively say that what a typical patent holder looks like today is one that is part of a large network and which is supported in their innovations by many other large networks of innovations.
A Quantitative Perspective
While these maps paint a vivid picture of how innovation has evolved through time in different places, we take a look at the numbers behind these maps before drawing definitive conclusions. From the first graph below we can see spectacular growth in the raw number of patent applications that are filed each year in the period under scrutiny. The number of utility patent applications in particular experiences a growth of 150% between 1990 and 2013. What also stands out from this graph is the almost constant proportion of patent types. 'Other Patents' include plant patents, defensive publications, and statutory invention registrations.While the growth in the number of patents is staggering, from the second graph shown below we learn that the increase in the number of inventors listed in patent applications has grown even more: from 1990 to 2013, a more than 160% increase. So while almost all research fields today require always more specialization, an ever growing number of innovators are required in practice to actually innovate. Contrast this conclusion with the information seen on the bottom-most graph, which illustrates the number of individuals listed as assignees in patent applications during each year under consideration. While the number grows until the start of the 2000's, it actually starts shrinking after this point.
The initial growth in individuals as inventors, we suspect, can be attributed to the Dot-com bubble. in the late 1990's to early 2000's, a lot of capital was flowing to people whom inventors perceived as being technological visionaries. After these flows started to dry up, the number of individuals as assignees also started coming back down. While there are still around 1500 patent applications every year filed by individuals, this completely pales in comparison to the number of innovations made by people that are part of teams. In fact, in the third graph from the top, we see that the number of innovators that are part of the top 10 US-based and Non-US-based companies or organizations (ranked by number of patent applications in each year) represent at any given time around 20 times the number of solo innovators.
Finally, when we look at the total number of patents which are cited in patent applications each year, we can definitively say that what a typical patent holder looks like today is one that is part of a large network and which is supported in their innovations by many other large networks of innovations.
In the table below, you can see the list of the top 10 US-based assignees for each year. The accompanying graph then shows the density of the inventors listed in the patent applications by those assignees.
| 1990 | 1991 | 1992 | 1993 | 1994 | 1995 | 1996 | 1997 | 1998 | 1999 | 2000 | 2001 | 2002 | 2003 | 2004 | 2005 | 2006 | 2007 | 2008 | 2009 | 2010 | 2011 | 2012 | 2013 | 2014 | 2015 | 2016 |
|---|---|---|---|---|---|---|---|---|---|---|---|---|---|---|---|---|---|---|---|---|---|---|---|---|---|---|
| Eastman Kodak | IBM Corp | IBM Corp | IBM Corp | IBM Corp | IBM Corp | IBM Corp | IBM Corp | IBM Corp | IBM Corp | IBM Corp | IBM Corp | IBM Corp | IBM Corp | IBM Corp | IBM Corp | IBM Corp | IBM Corp | IBM Corp | IBM Corp | IBM Corp | IBM Corp | IBM Corp | IBM Corp | IBM Corp | IBM Corp | IBM Corp |
| IBM Corp | Eastman Kodak | Eastman Kodak | Motorola, Inc. | Motorola, Inc. | Motorola, Inc. | Motorola, Inc. | Motorola, Inc. | Lucent Technologies Inc. | Micron Technology, Inc. | Micron Technology, Inc. | HP Development Company | HP Development Company | HP Development Company | Microsoft Corporation | Microsoft Corporation | Microsoft Corporation | Microsoft Corporation | Microsoft Corporation | Microsoft Corporation | Microsoft Corporation | Google Inc. | Google Inc. | Google Inc. | Google Inc. | QUALCOMM Incorporated | Apple Inc. |
| GE | GE | GE | GE | GE | Lucent Technologies Inc. | Eastman Kodak | Lucent Technologies Inc. | Micron Technology, Inc. | Intel Corporation | Intel Corporation | Micron Technology, Inc. | Intel Corporation | Intel Corporation | Intel Corporation | Intel Corporation | Intel Corporation | Intel Corporation | GE | QUALCOMM Incorporated | GE | GE | Intel Corporation | QUALCOMM Incorporated | QUALCOMM Incorporated | Apple Inc. | Intel Corporation |
| United States Navy | Motorola, Inc. | Motorola, Inc. | Eastman Kodak | Eastman Kodak | GE | Lucent Technologies Inc. | Micron Technology, Inc. | Eastman Kodak | Lucent Technologies Inc. | GE | Intel Corporation | Micron Technology, Inc. | Microsoft Corporation | HP Development Company | HP Development Company | Micron Technology, Inc. | HP Development Company | GM Global Technology, Inc. | GE | QUALCOMM Incorporated | Intel Corporation | Apple Inc. | Intel Corporation | Apple Inc. | Intel Corporation | Ford Global Technologies, LLC |
| Motorola, Inc. | United States Navy | United States Navy | United States Navy | Texas Instruments Incorporated | Texas Instruments Incorporated | Hewlett-Packard Company | Eastman Kodak | Intel Corporation | GE | Advanced Micro Devices, Inc. | GE | GE | Micron Technology, Inc. | Micron Technology, Inc. | Micron Technology, Inc. | GE | GE | QUALCOMM Incorporated | GM Global Technology, Inc. | Apple Inc. | Microsoft Corporation | GE | Apple Inc. | Intel Corporation | Ford Global Technologies, LLC | NIKE, Inc. |
| E.I. du Pont de Nemours and Co | Xerox Corporation | Xerox Corporation | Xerox Corporation | Xerox Corporation | Eastman Kodak | Intel Corporation | Advanced Micro Devices, Inc. | Motorola, Inc. | Advanced Micro Devices, Inc. | Microsoft Corporation | Advanced Micro Devices, Inc. | Microsoft Corporation | GE | GE | GE | HP Development Company | QUALCOMM Incorporated | AT&T INTELLECTUAL PROPERTY, L.P. | HP Development Company | GM Global Technology, Inc. | Apple Inc. | QUALCOMM Incorporated | GE | Ford Global Technologies, LLC | Google Inc. | QUALCOMM Incorporated |
| AT&T Bell Laboratories | E.I. du Pont de Nemours and Co | E.I. du Pont de Nemours and Co | Minnesota Mining and Manufacturing Company | United States Navy | United States Navy | U.S. Philips Corporation | Intel Corporation | Advanced Micro Devices, Inc. | Hewlett-Packard Company | Motorola, Inc. | Microsoft Corporation | Sun Microsystems, Inc. | Texas Instruments Incorporated | Broadcom Corporation | Cisco Technology, Inc. | Cisco Technology, Inc. | GM Global Technology, Inc. | Intel Corporation | Intel Corporation | Intel Corporation | QUALCOMM Incorporated | GM Global Technology, Inc. | Amazon Technologies, Inc. | MICROSOFT TECHNOLOGY LICENSING, LLC | MICROSOFT TECHNOLOGY LICENSING, LLC | Google Inc. |
| U.S. Philips Corporation | General Motors Corporation | Minnesota Mining and Manufacturing Company | Texas Instruments Incorporated | Minnesota Mining and Manufacturing Company | Xerox Corporation | GE | Hewlett-Packard Company | Hewlett-Packard Company | Xerox Corporation | HP Development Company | Texas Instruments Incorporated | Texas Instruments Incorporated | Cisco Technology, Inc. | Texas Instruments Incorporated | Xerox Corporation | QUALCOMM Incorporated | Broadcom Corporation | HP Development Company | AT&T INTELLECTUAL PROPERTY, L.P. | HP Development Company | GM Global Technology, Inc. | Amazon Technologies, Inc. | MICROSOFT TECHNOLOGY LICENSING, LLC | Amazon Technologies, Inc. | Amazon Technologies, Inc. | MICROSOFT TECHNOLOGY LICENSING, LLC |
| Xerox Corporation | AT&T Bell Laboratories | AT&T Bell Laboratories | AT&T Corp. | U.S. Philips Corporation | Minnesota Mining and Manufacturing Company | United States Navy | U.S. Philips Corporation | GE | Texas Instruments Incorporated | Eastman Kodak | Sun Microsystems, Inc. | Advanced Micro Devices, Inc. | Broadcom Corporation | Honeywell International, Inc. | Honeywell International, Inc. | Broadcom Corporation | Apple Inc. | Apple Inc. | Apple Inc. | Broadcom Corporation | HP Development Company | Microsoft Corporation | Ford Global Technologies, LLC | GE | NIKE, Inc. | GM Global Technology, Inc. |
| Minnesota Mining and Manufacturing Company | Minnesota Mining and Manufacturing Company | General Motors Corporation | U.S. Philips Corporation | Hewlett-Packard Company | U.S. Philips Corporation | Xerox Corporation | GE | Xerox Corporation | Microsoft Corporation | Lucent Technologies Inc. | Eastman Kodak | Eastman Kodak | Eastman Kodak | Cisco Technology, Inc. | Broadcom Corporation | Honeywell International, Inc. | AT&T INTELLECTUAL PROPERTY, L.P. | Honeywell International, Inc. | Xerox Corporation | Micron Technology, Inc. | MICROSOFT TECHNOLOGY LICENSING, LLC | MICROSOFT TECHNOLOGY LICENSING, LLC | GM Global Technology, Inc. | The Boeing Company | GE | Texas Instruments Incorporated |
What is interesting here is the density of inventors from US-based assignees in India, Singapore, China and South Korea. While there are close to no inventors in those regions in the early 1990's, their numbers start growing rapidly in the early 2000's. In general, inventors for US-based assignees seem to be spreading out much more today than they were only twenty years ago. This seems to be less the case for Non-US based assignees. From the map below, we can see that the largest Non-US based assignees have the bulk of their inventors based in Japan and South Korea throughout the entire period.
The numbers in Europe are also significant both for US and Non-US assignees. This is somewhat surprising when considering the fact that very few of the top assignees are actually European companies - Siemens and Bayer, both very large firms, are in the top 10 Non-US assignees only until the late 1990's. This paints a picture of Europe as global innovation hub.
The numbers in Europe are also significant both for US and Non-US assignees. This is somewhat surprising when considering the fact that very few of the top assignees are actually European companies - Siemens and Bayer, both very large firms, are in the top 10 Non-US assignees only until the late 1990's. This paints a picture of Europe as global innovation hub.
| 1990 | 1991 | 1992 | 1993 | 1994 | 1995 | 1996 | 1997 | 1998 | 1999 | 2000 | 2001 | 2002 | 2003 | 2004 | 2005 | 2006 | 2007 | 2008 | 2009 | 2010 | 2011 | 2012 | 2013 | 2014 | 2015 | 2016 |
|---|---|---|---|---|---|---|---|---|---|---|---|---|---|---|---|---|---|---|---|---|---|---|---|---|---|---|
| Toshiba KK | Toshiba KK | Canon KK | Canon KK | Canon KK | Canon KK | Canon KK | Canon KK | NEC Corporation | NEC Corporation | Matsushita Electric Industrial Co., Ltd. | Matsushita Electric Industrial Co., Ltd. | Matsushita Electric Industrial Co., Ltd. | Samsung Electronics Co., Ltd. | Samsung Electronics Co., Ltd. | Samsung Electronics Co., Ltd. | Samsung Electronics Co., Ltd. | Samsung Electronics Co., Ltd. | Samsung Electronics Co., Ltd. | Samsung Electronics Co., Ltd. | Samsung Electronics Co., Ltd. | Samsung Electronics Co., Ltd. | Samsung Electronics Co., Ltd. | Samsung Electronics Co., Ltd. | Samsung Electronics Co., Ltd. | Samsung Electronics Co., Ltd. | Samsung Electronics Co., Ltd. |
| Canon KK | Canon KK | Toshiba KK | Mitsubishi Denki KK | NEC Corporation | Fujitsu Limited | Samsung Electronics Co., Ltd. | NEC Corporation | Canon KK | Canon KK | Canon KK | Hitachi, Ltd. | Samsung Electronics Co., Ltd. | Canon KK | Canon KK | Canon KK | Canon KK | Canon KK | Canon KK | Canon KK | Canon KK | Canon KK | Canon KK | Canon KK | Canon KK | Canon KK | Canon KK |
| Hitachi, Ltd. | Hitachi, Ltd. | Hitachi, Ltd. | Toshiba KK | Toshiba KK | Mitsubishi Denki KK | NEC Corporation | Sony Corporation | Sony Corporation | Sony Corporation | Sony Corporation | Sony Corporation | Canon KK | Matsushita Electric Industrial Co., Ltd. | Sony Corporation | Sony Corporation | Sony Corporation | Sony Corporation | Sony Corporation | Sony Corporation | Sony Corporation | Sony Corporation | Sony Corporation | LG Electronics Inc. | LG Electronics Inc. | LG Electronics Inc. | Taiwan Semiconductor Manufacturing Company, Ltd. |
| Fuji Photo Film Co., Ltd. | Mitsubishi Denki KK | Mitsubishi Denki KK | Hitachi, Ltd. | Mitsubishi Denki KK | Sony Corporation | Sony Corporation | Fujitsu Limited | Samsung Electronics Co., Ltd. | Matsushita Electric Industrial Co., Ltd. | NEC Corporation | Canon KK | Hitachi, Ltd. | Sony Corporation | Toshiba KK | Toshiba KK | Toshiba KK | Toshiba KK | Toshiba KK | Toshiba KK | Hon Hai Precision Industry Co., Ltd. | Toshiba KK | Toshiba KK | Taiwan Semiconductor Manufacturing Company, Ltd. | Samsung Display Co., Ltd. | Samsung Display Co., Ltd. | LG Electronics Inc. |
| Mitsubishi Denki KK | Matsushita Electric Industrial Co., Ltd. | Matsushita Electric Industrial Co., Ltd. | Matsushita Electric Industrial Co., Ltd. | Fujitsu Limited | Toshiba KK | Toshiba KK | Samsung Electronics Co., Ltd. | Fujitsu Limited | Hitachi, Ltd. | Hitachi, Ltd. | Koninklijke Philips Electronics N.V. | Sony Corporation | Toshiba KK | Matsushita Electric Industrial Co., Ltd. | Fujitsu Limited | Panasonic Corporation | Panasonic Corporation | Panasonic Corporation | Hon Hai Precision Industry Co., Ltd. | Toshiba KK | Hon Hai Precision Industry Co., Ltd. | LG Electronics Inc. | Toshiba KK | Taiwan Semiconductor Manufacturing Company, Ltd. | Taiwan Semiconductor Manufacturing Company, Ltd. | Seiko Epson Corporation |
| Matsushita Electric Industrial Co., Ltd. | Fuji Photo Film Co., Ltd. | NEC Corporation | Sony Corporation | Hitachi, Ltd. | Hitachi, Ltd. | Fujitsu Limited | Toshiba KK | Toshiba KK | Samsung Electronics Co., Ltd. | Fujitsu Limited | Samsung Electronics Co., Ltd. | Toshiba KK | Hitachi, Ltd. | Hitachi, Ltd. | Panasonic Corporation | LG Electronics Inc. | LG Electronics Inc. | LG Electronics Inc. | Panasonic Corporation | LG Electronics Inc. | LG Electronics Inc. | Fujitsu Limited | Sony Corporation | Sony Corporation | Toshiba KK | Toyota Jidosha Kabushiki Kaisha |
| Bayer Aktiengesellschaft | Sony Corporation | Sony Corporation | Fujitsu Limited | Matsushita Electric Industrial Co., Ltd. | NEC Corporation | Mitsubishi Denki KK | Mitsubishi Denki KK | Matsushita Electric Industrial Co., Ltd. | Fujitsu Limited | Mitsubishi Denki KK | Fujitsu Limited | Koninklijke Philips Electronics N.V. | Seiko Epson Corporation | Seiko Epson Corporation | Seiko Epson Corporation | Seiko Epson Corporation | Toyota Jidosha Kabushiki Kaisha | Hitachi, Ltd. | LG Electronics Inc. | Panasonic Corporation | Toyota Jidosha Kabushiki Kaisha | Taiwan Semiconductor Manufacturing Company, Ltd. | Samsung Display Co., Ltd. | Toshiba KK | Seiko Epson Corporation | Toshiba KK |
| Siemens Aktiengesellschaft | NEC Corporation | Fuji Photo Film Co., Ltd. | NEC Corporation | Sony Corporation | Matsushita Electric Industrial Co., Ltd. | Matsushita Electric Industrial Co., Ltd. | Matsushita Electric Industrial Co., Ltd. | Mitsubishi Denki KK | Toshiba KK | Samsung Electronics Co., Ltd. | Toshiba KK | Fujitsu Limited | Fujitsu Limited | Fujitsu Limited | Hitachi, Ltd. | Hitachi, Ltd. | Seiko Epson Corporation | Hon Hai Precision Industry Co., Ltd. | Fujitsu Limited | Fujitsu Limited | Panasonic Corporation | Hon Hai Precision Industry Co., Ltd. | Fujitsu Limited | Seiko Epson Corporation | Hyundai Motor Company | Samsung Display Co., Ltd. |
| Fujitsu Limited | Fujitsu Limited | Fujitsu Limited | Fuji Photo Film Co., Ltd. | Fuji Photo Film Co., Ltd. | Samsung Electronics Co., Ltd. | Hitachi, Ltd. | Hitachi, Ltd. | Hitachi, Ltd. | Mitsubishi Denki KK | Toshiba KK | Mitsubishi Denki KK | Robert Bosch GmbH | Infineon Technologies AG | LG Electronics Inc. | LG Electronics Inc. | Fujitsu Limited | Hitachi, Ltd. | Toyota Jidosha Kabushiki Kaisha | Toyota Jidosha Kabushiki Kaisha | Toyota Jidosha Kabushiki Kaisha | Seiko Epson Corporation | Telefonaktiebolaget L M Ericsson (publ) | Seiko Epson Corporation | Fujitsu Limited | Huawei Technologies Co., Ltd. | SK hynix Inc. |
| Sony Corporation | Sharp Kabushiki Kaisha | Sharp Kabushiki Kaisha | Samsung Electronics Co., Ltd. | Samsung Electronics Co., Ltd. | NOK Corporation | Fuji Photo Film Co., Ltd. | Siemens Aktiengesellschaft | Siemens Aktiengesellschaft | Siemens Aktiengesellschaft | Koninklijke Philips Electronics N.V. | NEC Corporation | Infineon Technologies AG | Koninklijke Philips Electronics N.V. | Honda Motor Co., Ltd. | Honda Motor Co., Ltd. | Hon Hai Precision Industry Co., Ltd. | Fujitsu Limited | Seiko Epson Corporation | Seiko Epson Corporation | Seiko Epson Corporation | Fujitsu Limited | Seiko Epson Corporation | Ricoh Company, Ltd. | Huawei Technologies Co., Ltd. | Ricoh Company, Ltd. | Ricoh Company, Ltd. |
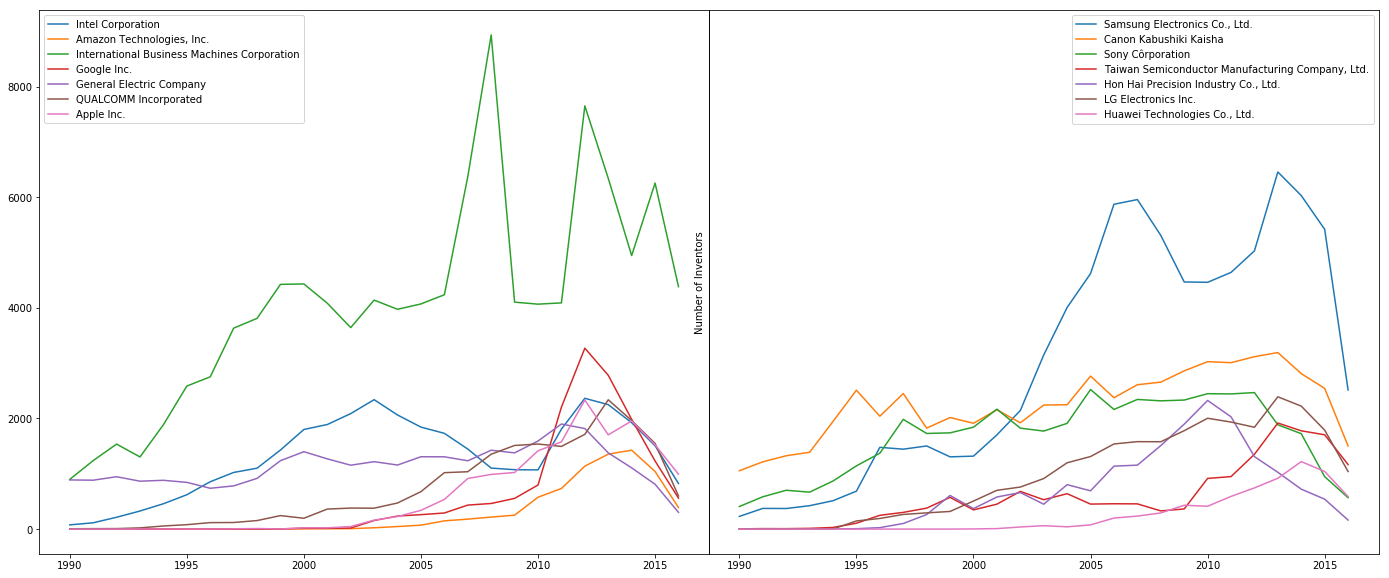
The graph below offers a more compact illustration of the two tables above. The graphs show the evolution of the number of inventors for some of the most important assignees in the world. On the US side, IBM clearly dominates, though the explosion in the number of patent applications by Google after 2010 may signal a change in leadership. We also notice the steady yet sure advance of Amazon, and the stark contrast with Intel, whose numbers appear to indicate some instability.
On the Non-US side, we notice that the trends are much more stable, with the exception of Samsung Electronics, whose quick rise is truly astonishing. It is also interesting to see the divergence between the two Apple suppliers Hon Hai Precision Industry and Taiwan Semiconductor.
Finally, on both these graphs, the 2008 financial crises really stands out. For both the largest US and Non-US assignees, this event caused a huge dent in the number of inventors, though they had both recovered by 2013, which speaks volumes to the relentless charge of innovation.
From what was seen up until this point, we can paint a pretty clear picture of what a typical innovator looks like today. An innovator today does not go at it alone. They are usually part of an organization (about 10% of all inventors are part of the top 10 US-based or top 10 Non-US based assignees), and on average, more than half the time, it takes 2 inventors to make a patent.
Region also counts for a lot. We have seen at the very beginning that being in a developing or an underdeveloped country means that your chances of being an innovator are drastically reduced. But even in a developed country like the United-States, the difference still today is large between the dense urban regions and, e.g. the Mountain States. In China also, the difference between Shanghai, Peking, and Hong Kong, and the rest of the country is large. The density of innovation is likely not a direct cause of mass migrations per se, but looking at the issue through this perspective is nonetheless interesting. Rapid urbanisation undeniably brings about issues related to food, water, and housing, to name the most obvious examples. To stand a fighting chance requires the work of brilliant innovators working on these issues. So in order to maintain the standard of living which attracts people to urban centers requires more innovators. The big picture here is then that being an innovator has never been more accessible, given that you are in any one of the blue regions on the map in the very top of this page, and that it is better to be part of this global network with multiple entry points, if you want to be a successful innovator.
Part 2. Peeling Back the Layers.
In this second part, we focus on a few examples of similar patents across similar companies, and we analyze the networks supporting those patents in view of what we have seen in the first part. The goal is to figure out whether the networks supporting the innovations of companies in a specific sector of activity will be self-contained or not. We also want to see for a same company, if those networks have evolved in any significant way between in the past few decades.
Below, you will find a list of the comparisons we have made. For each of the comparisons, you can display any of the "layers" of innovation behind the companies chosen patent. Each layer in fact represents the density of the inventors listed in the patent applications of that layer. In other words, when Layer 0 is active, the map shows the locations of the inventors of the original patent. Layer 1 then shows the locations of the inventors for the patents which were cited by the patents in Layer 0, Layer 2 then shows the locations of the inventors for the patents which were cited by the patents in Layer 1 etc. Each analysis also contains a table with the similarities between compared patents at each level. The similarity, in this case, is defined as the number of patents citations which are included in both network, divided by the total number of patent citations. Both the number of patent citations and the number of total patents are cumulative with respect to the layers, in order to account for the fact that patents may not be cited at the same layer for both networks.
You can view the analysis in any particular order.
-
Tencent and Facebook
-
Rochester University and Dresden University
-
Autonomous Navigation Technology
-
Samsung in 1995 and in 2010
The takeaway from these examples is that, while all of these networks have some overlap, even similar patents by similar companies can be supported by networks that do not overlap by more than 60-70% after peeling back 3 to 4 layers. When we look at academic institutions, or when we compare corporations with government bodies like the Navy, these networks are even more distinct. This goes to show that if two groups are working towards the same goal, neither of them need be superfluous. Any amount of innovation today can have an impact, as innovators are constantly and incessantly building on top of previous work, using different sources as support.